Send the exact assignment or rubric from your classroom and a custom sample written to it lands in 24 to 48 hours, the first one free. NR 586NP is Chamberlain’s Population Health and Epidemiology for Advanced Nursing Practice course. It centers on reasoning about a population instead of a patient, where a number means nothing until you say among whom and over how long. Searches like "nr 586np week 4 assignment example", "NR586NP sample paper", and "NR 586NP week samples" land on this page.
What NR 586NP is really about
Everything else in this sequence teaches you to think about the person in front of you, and NR 586NP asks you to stop. The patient here is a population, and the change is not a matter of scale. Clinical reasoning starts from a presentation and works toward a cause in one body; population reasoning starts from a distribution and asks why it sits where it sits. That is why counts alone say almost nothing in this classroom. Two hundred cases is a frightening number in a town and an unremarkable one in a state, so a figure without the people it was drawn from and the period it covers is not yet a finding.
The same shift governs everything the course asks you to judge. A screening test that looks excellent in a specialty clinic behaves differently in a general population, because how often the disease is actually present changes what a positive result is worth. A difference between two groups is only a disparity once you have named the comparison and measured it. An intervention that helped the people who attended has still missed everybody who could not attend, and reach is part of the result rather than a footnote to it. Writing that keeps a denominator, a comparison group and a time period in view lands close to where the rubric already sits.
What NR 586NP’s assessments ask for
Weekly work alternates between describing a population and judging something done to one. Description assignments want the profile assembled: who lives there, what is measured about them, where the numbers come from, and what the source cannot tell you. Calculation appears often enough that comfort with rates matters, and the marking follows whether you chose the right denominator far more than whether the arithmetic is tidy. Judgment assignments hand you a screening program, a vaccination push or a community intervention and ask whether it worked, for whom, and who it never reached. Discussions open the week on a determinant of health and reward a reply that treats it as a cause with a mechanism rather than as unfortunate background.
Where students lose points in NR 586NP
The most common loss here is the case report in disguise: a paragraph about a typical resident, written with real feeling, standing in for a population that was never counted. The second loss is the naked number, a total with no denominator behind it, which cannot be compared with anything and therefore cannot support a recommendation. Third is the confusion of incidence with prevalence, where new cases and existing cases are used interchangeably and the argument silently changes direction. Social determinants listed as context instead of examined as causes, an association reported as though it were established cause, screening praised without asking what a false positive costs, and interventions judged only on the people who showed up all cost points.
The NR 586NP drawers
NR 586NP Week 1 discussion post example
Week 1 in many sections asks what changes when the patient becomes a population. On request, free, 24-48h.
NR 586NP Week 2 community profile example
Week 2 generally moves to the people, the sources and what those sources miss. On request, free, 24-48h.
NR 586NP Week 3 rate calculation write-up example
Week 3 tends to put a number over the right denominator and defend it. On request, free, 24-48h.
NR 586NP Week 4 surveillance data review example
Week 4 generally builds a picture from reported cases and the gaps behind them. On request, free, 24-48h.
NR 586NP Week 5 screening program appraisal example
Week 5 in many sections weighs a screening test against how common the disease is. On request, free, 24-48h.
NR 586NP Week 6 health disparity analysis example
Week 6 commonly narrows to one group and the comparison that makes a gap visible. On request, free, 24-48h.
NR 586NP Week 7 population intervention plan example
Week 7 typically weighs an intervention by who it reached and who it missed. On request, free, 24-48h.
NR 586NP Week 8 policy brief example
Week 8 generally closes on a recommendation aimed at whoever can fund it. On request, free, 24-48h.
Your classroom shows something else?
Chamberlain University revises courses; week counts and deliverables shift between terms. Send what your classroom shows and the desk matches it exactly.
Using a NR 586NP sample the right way
Read a sample for its numbers, not its topic. Look at how each figure arrives with a denominator and a period attached, how a comparison group appears before any claim of disparity, and how the writer says what the data source leaves out. Then rebuild it around the area you are actually writing about, since the county, the census figures and the local reporting you pull are yours to gather and your assignment will be marked on the fit between them. What the sample gives you is the shape of a population argument and the discipline of never letting a number stand alone.
How these samples are written
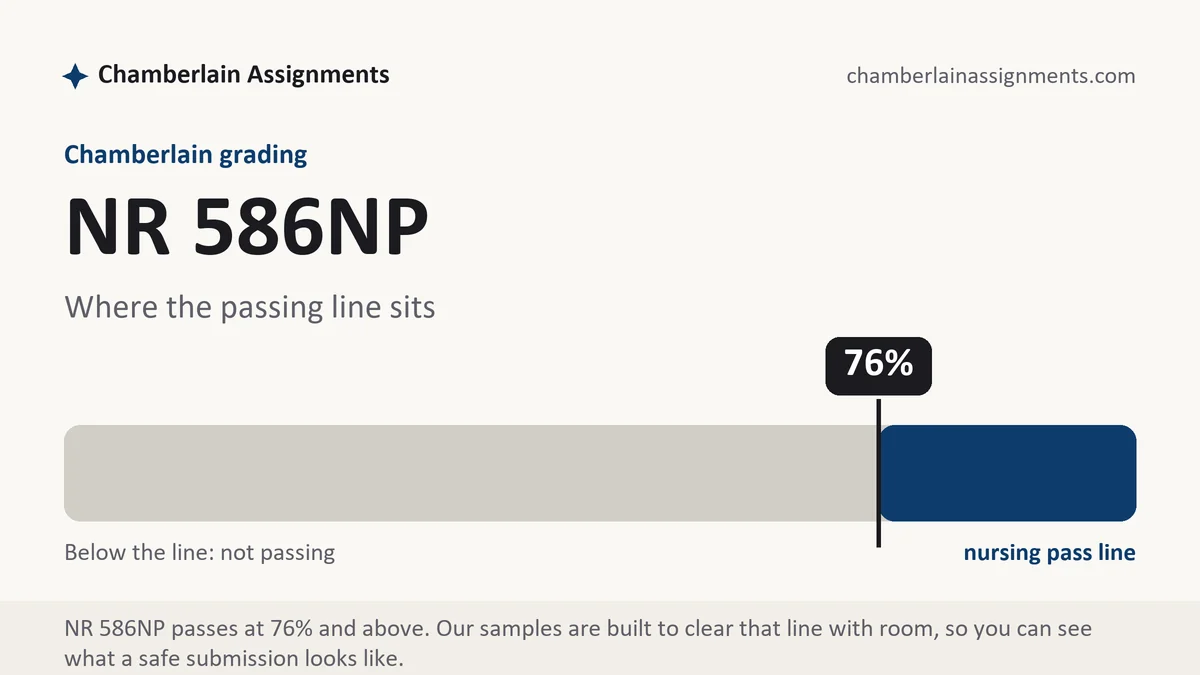
The discipline behind every paper here: the rubric is the outline, each row gets its section, one-shot discussions get the one-shot treatment, and the 76 percent floor is treated as the cliff it is. Send your week's instructions with a request and the sample matches them, revisions included.
NR 586NP questions, answered
Do I have to do the calculations myself?
The arithmetic is the small part, and yes, it should be yours. What the assignment marks is the choice underneath it: which denominator, which period, which comparison. A sample can show a rate laid out so a reader can check it, with every figure sourced, and where a classroom template sets the columns the figures drop into those.
My community has almost no local data.
Say that in the paper, then work outward. Use the county or state figure, state plainly that you are borrowing it, and explain what could make your area differ from the one the number describes. Thin data handled openly reads as competence; a confident local statistic with no source behind it reads as invention, and that difference alone can be a letter grade.
How much epidemiology vocabulary is expected?
Enough to be precise, used where precision matters. Incidence, prevalence, relative risk and sensitivity are not decoration; each one commits you to a particular denominator and a particular claim, so using the wrong term changes what you have argued. Define nothing at length, but choose carefully, and let the number you report match the word you used.